Traffic Graphs
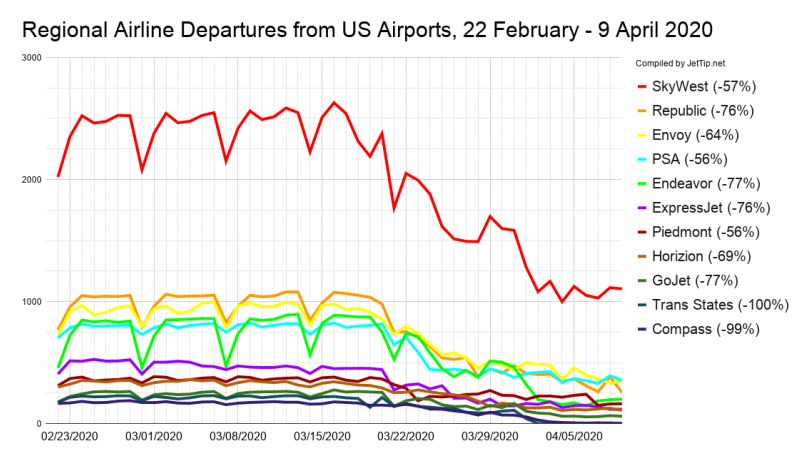
Yesterday was the slowest post-crisis day for several airlines and airports, with Air Canada, ExpressJet, Republic, Spirit, and Mesa, and airports FLL, JFK, LAX, and PHX posting their lowest numbers.
TSA's numbers remain at lowest percentage (-96%) since the crisis started.
Methodology notes can be found at the bottom of this post.
News from Elsewhere
- Tracking the Impacts of COVID-19; Some Early Indicators; Airlines for America
- 3 Links I Love: Awful Data Points, Parking Airplanes on Opposite Sides of the World, Brett Snyder, Cranky Flier
- Setting all the wrong records (podcast), FlightRadar24
- Cargo In An Aircraft Cabin? You’ll Need A Flight Attendant; Will Horton, Forbes
Additional Aviation News Resources
If you're looking to keep tabs on what's going on, there are lots of great places to be keeping track of aviation news.
- JetTip's Aviation News list with tweets from generally reliable sources
- JetTip's realtime diversion tracking page
- Coronavirus Flight Cancelation Tracker
- TSA Sreening Volume
- The Air Current
- PaxEx.Aero
- Cranky Flier's Daily Update
- Ethan Klapper's Bluer Skies
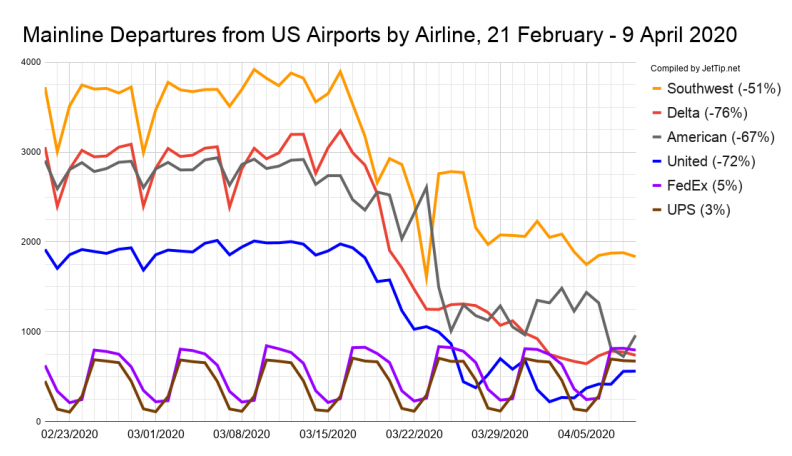
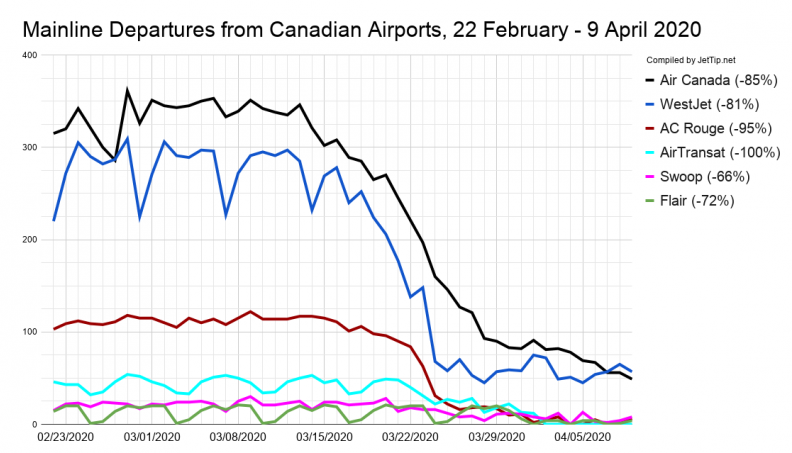
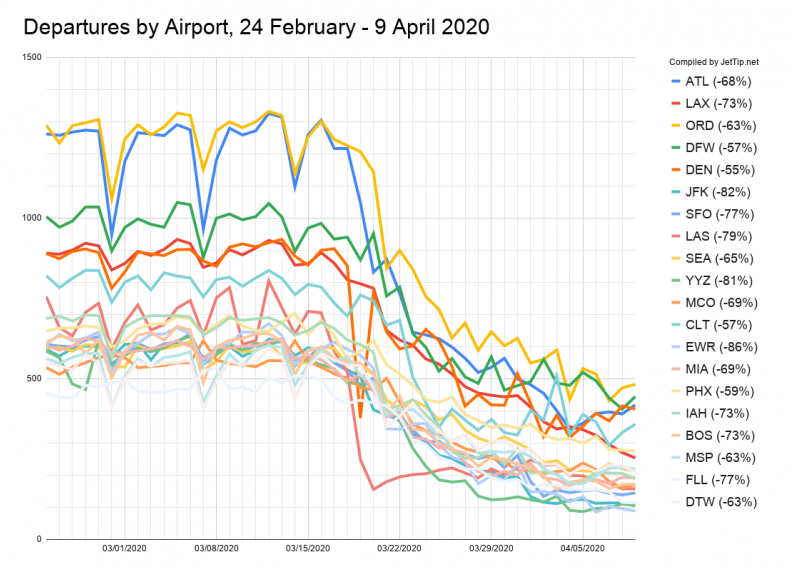
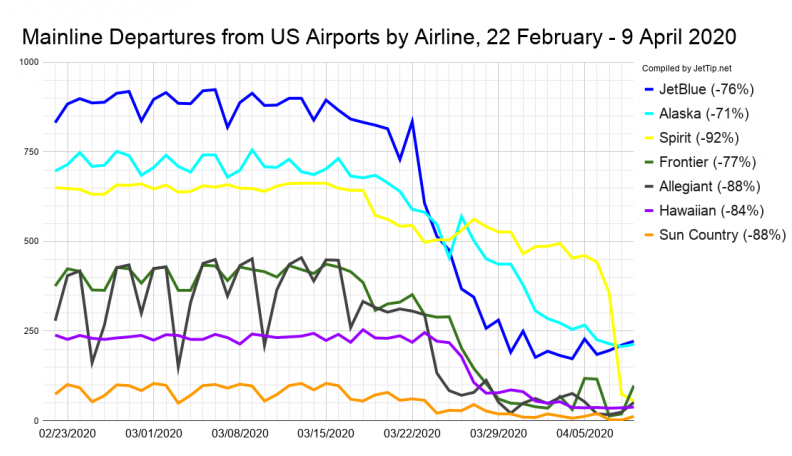
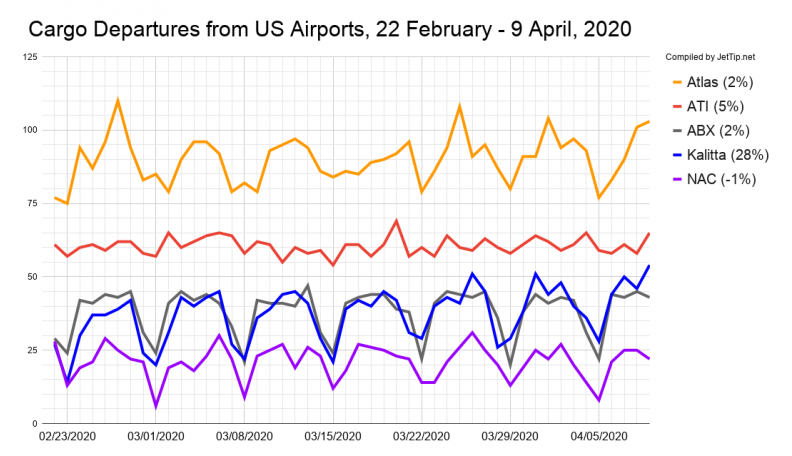
Methodology: Departures by Airline Since Late February
COVID-19 started impacting aviation in China at the end of January, which also impacted the US and Canadian routes to Asia, but large differences in the number of flights being operated by carriers on this side of the Pacific didn't really start adding up until a couple of weeks ago. A few places had been sharing global trends, but I was selfishly interested in an airline by airline breakdown of how significant the impact had been.
So, here are some graphs and an airline by airline breakdown in the decrease in traffic from US and Canadian airlines over the last month. The methodology here is to count all flights between 12:00:00 AM and 11:59:59 PM eastern time that departed from an airport in the airline's respective home country (Delta departures from US airports, WestJet departures from Canadian airports, etc.). Since commercial airline schedules are highly cyclical, the percent change is derived by comparing the specified day's count compared to the average of the number of flights each airline operated during three previous "pre-crisis" weeks, 22 February - 13 March.

Nick Benson
Nick lives in Burnsville, Minnesota with his wife and three children. He grooves on railroad and aviation photography, politics, geography, weather, and LEGO. He started JetTip's smart flight alert service in 2017, and is now a full-time avgeek. He can frequently be found atop a step ladder at MSP's Aircraft Viewing Area.
Recent Posts
NFL 2023 - conference championship round team charter flights
NFL 2023 - divisional round team charter flights
NFL 2023 - wild card team charter flights
NFL 2023 - week 18 team charter flights
NFL 2023 - week 17 team charter flights
News
JetTip Features, Trip Report, Special Liveries, Events, COVID-19, Press Releases
Airline
Delta, Icelanndair, Sun Country, UPS Airlines